I'm at the yearly gathering of Investigative Reporters & Editors and am going to report to you some of great ideas for student journalists that I'm getting here.
First Off: Use maps and timelines to report your story not just to present it to readers.

That's the advice from Washington Post Sarah Cohen. She's the author of the book Numbers in the Newsroom which is a great guide for the math-challenged.
She said that more of us in journalism are mapping out information in our stories, but only towards the end of the information gathering process and only as a way to help explain the story to readers.
Instead, she said, map out your information as you get it, in the very beginning of your investigation. Why?
It will help you see where you physically need to go to report the story. Exactly where something happened and where it is still happening.
It can help you spot trends.
The same goes for timelines. "A chronology and a timeline is a great reporting tool," she said.
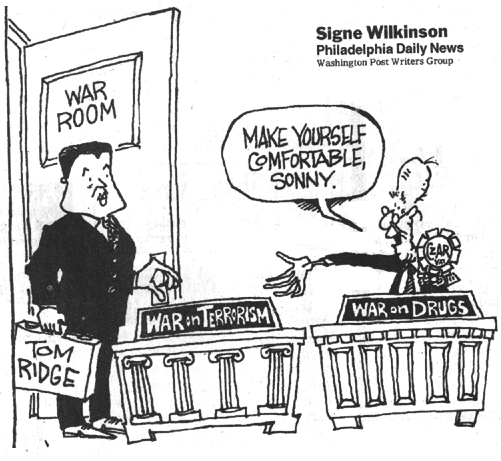
She gave this example: By getting the calendar for T om Ridge, when he headed the Department of Homeland Security, Washington Post reporters realized how little he worked. They color-coded days he was away on political trips and days he didn't work a full eight hours.
When using visual tools like a map or timeline for investigating rather than presenting information to readers, it doesn't have to be pretty.

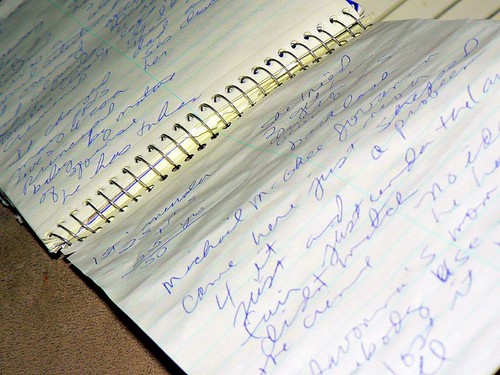
BUT... Be careful when deciding whether to publish the map or timeline you used as a reporting tool. You need to take the same care in publishing the visual elements as you would for scribbles in your notebook. Is the information accurate? Is it truthful? Can you tell the difference? Did it come from reputable, verifiable sources?

That's the advice from Washington Post Sarah Cohen. She's the author of the book Numbers in the Newsroom which is a great guide for the math-challenged.
She said that more of us in journalism are mapping out information in our stories, but only towards the end of the information gathering process and only as a way to help explain the story to readers.
Instead, she said, map out your information as you get it, in the very beginning of your investigation. Why?
It will help you see where you physically need to go to report the story. Exactly where something happened and where it is still happening.
It can help you spot trends.
The same goes for timelines. "A chronology and a timeline is a great reporting tool," she said.
She gave this example: By getting the calendar for T
 om Ridge, when he headed the Department of Homeland Security, Washington Post reporters realized how little he worked. They color-coded days he was away on political trips and days he didn't work a full eight hours.
When using visual tools like a map or timeline for investigating rather than presenting information to readers, it doesn't have to be pretty.

BUT... Be careful when deciding whether to publish the map or timeline you used as a reporting tool. You need to take the same care in publishing the visual elements as you would for scribbles in your notebook. Is the information accurate? Is it truthful? Can you tell the difference? Did it come from reputable, verifiable sources?


